
MS

DailyPlay – Opening Trade (MS) – July 15, 2025
MS Bullish Opening Trade Signal
Investment Rationale
Investment Thesis:
Morgan Stanley (MS) offers an attractive bullish setup heading into its Q2 earnings report on Wednesday, July 16th, before the market open. With equity markets hovering near all-time highs and a resurgence in capital markets activity, MS is well-positioned to capitalize on strength across both its institutional advisory and wealth management franchises. The stock trades at a relative valuation discount while delivering consistent margin strength, creating a favorable backdrop for multiple expansion. Near-term catalysts include rising asset prices, recovering deal volumes, and the potential for a beat-and-raise earnings print.
Technical Analysis:
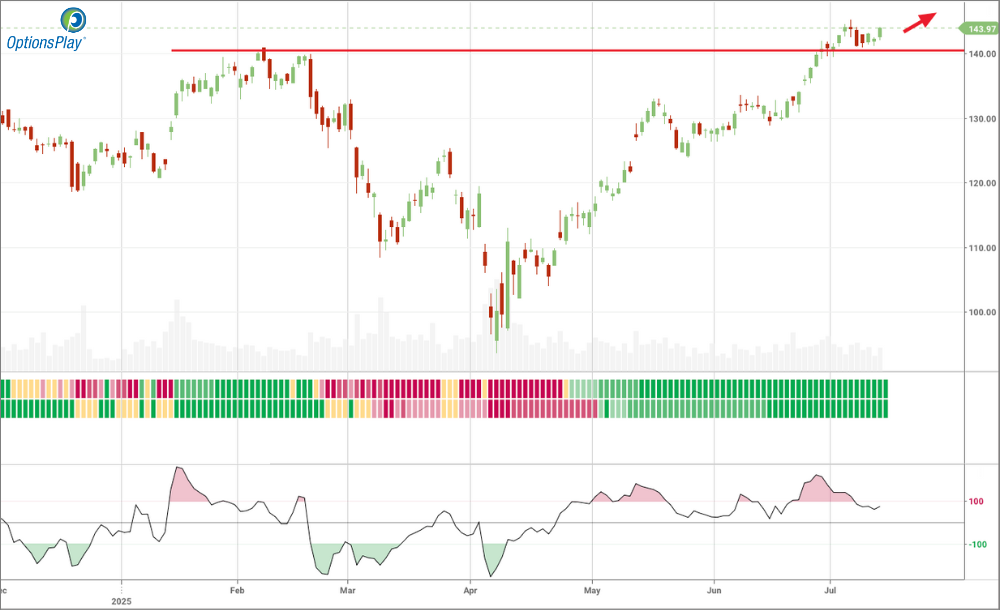
Morgan Stanley continues to trade in a well-defined uptrend, holding above all key moving averages with the 20-day MA providing consistent support. The stock cleared major resistance at $140 earlier this month and has since been consolidating just below its record high of $145.16, set on July 7th. Momentum remains strong, with an RSI near 70 and improving relative strength, suggesting bullish conditions without signaling exhaustion. A strong earnings report could serve as a breakout trigger, propelling the stock into new highs with an intermediate target near $160. Initial support sits at $138, aligning with both the 20-day MA and recent breakout level.
Fundamental Analysis:
Morgan Stanley trades at a discount to peers while maintaining robust profitability, particularly in net margins where it outperforms the industry. Although its growth metrics are slightly below average, the firm’s balanced revenue streams and consistent operating leverage support durable earnings power.
- Price to Book (PB) Ratio: 2.38x vs. Industry Average 4.29x
- Expected EPS Growth: 9.05% vs. Industry Average 11.9%
- Expected Revenue Growth: 6.84% vs. Industry Average 7.01%
- Net Margins: 27.38% vs. Industry Average 21.10%
MS’s ability to sustain above-average margins highlights management’s discipline and efficiency, key differentiators amid evolving macro conditions.
Options Trade:
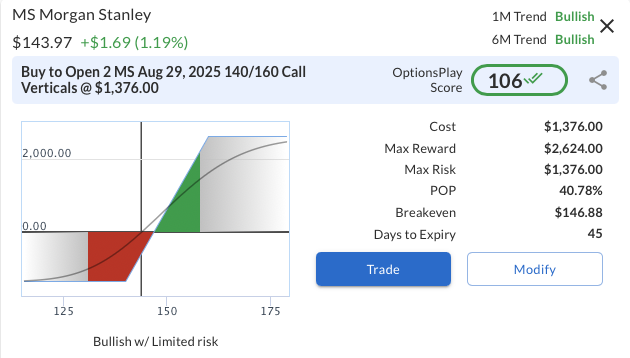
Buy the MS Aug 29, 2025 $140/$160 Call Vertical for $6.88. This defined-risk spread targets a continued move higher post-earnings, offering a maximum profit of $1,312 if the stock closes above $160 at expiration. With MS currently trading near $144, the $140 strike is already in the money, providing positive delta and directional exposure while capping the premium cost. The structure delivers a favorable 1.9:1 reward-to-risk ratio, making it a capital-efficient way to express bullish conviction into and beyond the earnings event.
MS – Daily
Trade Details
Strategy Details
Strategy: Long Call Vertical Spread
Direction: Bullish Debit Spread
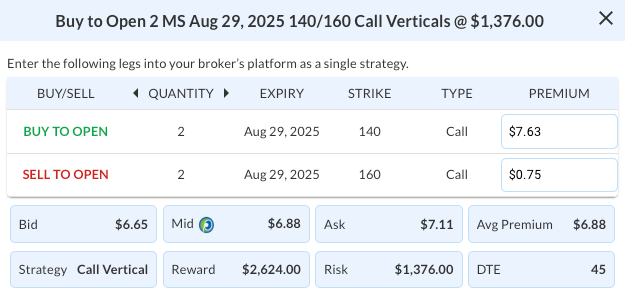
Details: Buy to Open 2 MS Aug 29 $140/$160 Call Vertical Spreads @ $6.88 Debit per Contract.
Total Risk: This trade has a max risk of $1,376 (2 Contracts x $688) based on a hypothetical $100k portfolio risking 2%. We suggest risking only 2% of the value of your portfolio and divide it by $688 to select the # contracts for your portfolio.
Trend Continuation Signal: This is a bullish trade on a stock that is expected to continue higher over the duration of this trade.
1M/6M Trends: Bullish/Bullish
Relative Strength: 9/10
OptionsPlay Score: 106
Stop Loss: @ $3.44 (50% loss of premium)
View MS Trade
Entering the Trade
Use the following details to enter the trade on your trading platform. Please note that whenever there is a multi-leg option strategy, it should be entered as a single trade.
PLEASE NOTE that these prices are based on Monday’s closing prices. Should the underlying move significantly during the pre-market hours, we will likely adjust the strikes and prices to reflect a more accurate trade entry.
View MS Trade

DailyPlay – Portfolio Review – July 14, 2025
DailyPlay Portfolio Review
Our Trades
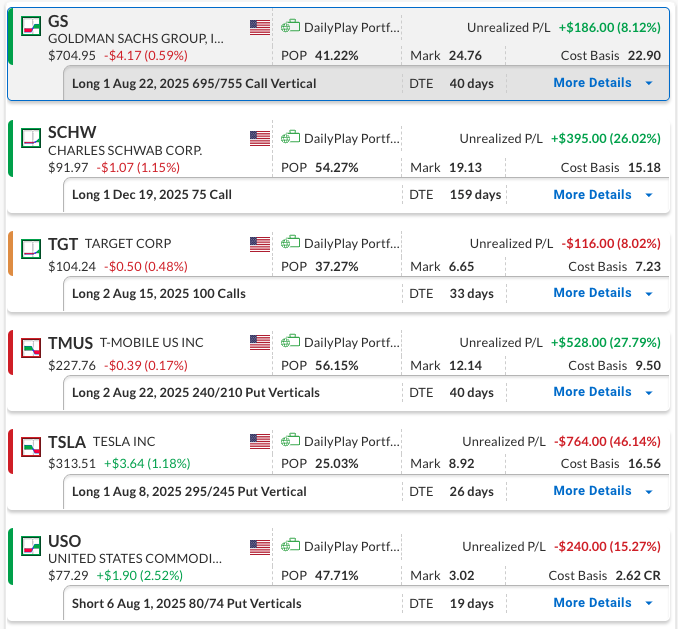
GS – DTE 40
Bullish Debit Spread – Goldman Sachs Group, Inc. (GS) – The position, opened recently, is showing a modest gain. Goldman Sachs is scheduled to report earnings on Wednesday, July 16th, before the market opens. We plan to maintain the trade and will likely carry it through the announcement.
SCHW – DTE 159
Bullish Long Call – Charles Schwab Corp. (SCHW) – We maintain a positive outlook, driven by solid company fundamentals and ongoing strength across SCHW and the broader financial sector. The company is scheduled to report earnings on Friday, July 18th, before the market opens.
TGT – 33 DTE
Bullish Long Call – Target Corporation (TGT) – The position is currently at a small loss. After breaking through resistance at the 100 level, the stock has been range-bound. A move above 106 would be encouraging, while a close below 100 would be concerning. With ample time until expiration, we’ll maintain the position, as the potential for further upside is still intact.
TMUS – 40 DTE
Bearish Debit Spread – T-Mobile US, Inc. (TMUS) – We recently established this position and plan to stay the course for now. The stock has struggled to hold above the 20-day moving average and is currently trading below both the 50- and 200-day moving averages, signaling continued weakness. We currently have a slight gain on the position. The company is scheduled to report earnings on Wednesday, July 23, after the market closes.
TSLA – 26 DTE
Bearish Debit Spread – Tesla, Inc. (TSLA) – We recently established a bearish position on TSLA, which is currently down. We intend to hold for now, anticipating continued pressure. The stock is testing critical moving averages (20-, 50-, and 200-day), with price consolidating in a tight range and trading volume light, indicating a wait for earnings. Tesla’s earnings report, scheduled for Wednesday, July 23rd, after the close, will be a key catalyst. We plan to stay the course, keep a close eye as the event approaches, and may ride the position through the earnings report.
USO – 19 DTE
Bullish Credit Spread – United States Oil Fund, LP (USO) – The position is currently down, and we’re keeping a close eye on oil prices following the OPEC International Seminar on July 9 and 10. Oil has been trending upward since the event. With plenty of time remaining until expiration, we plan to stay the course and see if the momentum can continue.
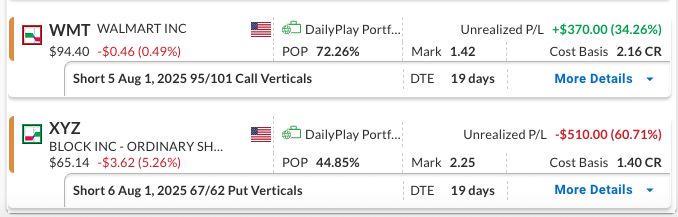
WMT – 19 DTE
Bearish Credit Spread – Walmart Inc. (WMT) – This bearish position is currently down, but the stock showed downside momentum last week, closing below both the 20- and 50-day moving averages. For now, we plan to hold steady.
XYZ – 19 DTE
Bullish Credit Spread – Block, Inc. (XYZ) – Block had been steadily building upside momentum, trading above both its 20- and 50-day moving averages. However, the stock ran into resistance at the 200-day moving average near the 71 level and pulled back to close the week lower. The position is currently down, but the broader setup still appears solid. We plan to stay the course for now.
ABNB

DailyPlay – Closing Trade (ABNB) – July 11, 2025
ABNB – 0.37% loss: Buy to Close 3 Contracts (or 100% of your Contracts) July 25 $138/$130 Put Vertical Spreads @ $2.69 Debit.
DailyPlay Portfolio: By Closing 3 Contracts, we will be paying $807. We initially opened these 3 contracts on June 13 @ $2.68 Credit. Our loss, therefore, is $1 per contract.
GS
DailyPlay – Opening Trade (GS) – July 10, 2025
GS Bullish Opening Trade Signal
Investment Rationale
Investment Thesis
Goldman Sachs (GS) approaches its July 16th earnings report with strong momentum, having exceeded consensus expectations in each of the past four quarters. The firm’s disciplined approach, simplified post-restructuring model, and strong capital markets presence position it well in a gradually improving macro environment. Additionally, a potential easing in M&A regulation could serve as a tailwind, reducing compliance costs, accelerating deal approvals, and boosting transaction volume. These dynamics would not only enhance advisory fee revenue but also reinforce Goldman’s leadership in M&A advisory. With shares pulling back modestly within a well-established uptrend, current levels may present a tactical opportunity for bullish exposure ahead of the print.
Technical Analysis
GS remains in a strong uptrend, having advanced more than 25% from its May lows. The stock recently pulled back from the $705 level and is now consolidating near its 20-day moving average, which has acted as reliable support during this rally. A bullish continuation pattern may be forming, with $726 marked as the next key resistance. Momentum remains constructive, RSI is holding above 60, and a recent dip in the Commodity Channel Index (CCI) during the broader trend suggests a potential entry point as the indicator begins to recover.
Fundamental Analysis
While Goldman’s forward growth expectations trail the industry average, the firm continues to deliver superior profitability and attractive relative valuation. Its high-margin business mix and operational efficiency support sustained earnings power. Notably, GS trades well below peers on a price-to-book basis, reinforcing its value proposition.
- Price to Book (PB) Ratio: 1.96 vs. Industry Average 4.29
- Expected EPS Growth: 9.77% vs. Industry Average 11.9%
- Expected Revenue Growth: 3.39% vs. Industry Average 7.01%
- Net Margins: 27.38% vs. Industry Average 21.10%
Goldman’s net margins of 27.38% significantly outperform the industry average, underscoring the firm’s operating efficiency and consistent earnings quality.
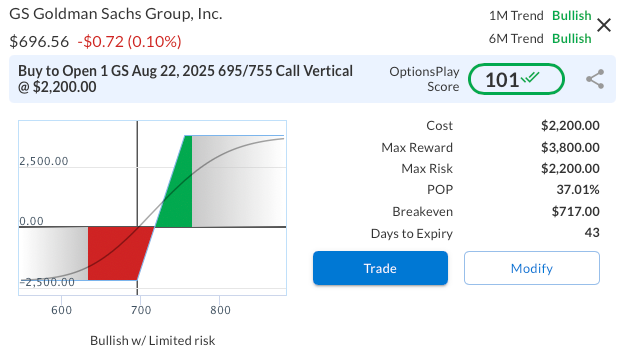
Options Trade
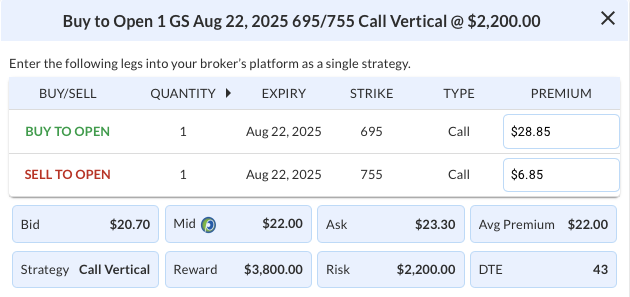
To position for a continued move higher, consider the GS Aug 22nd 695/755 call spread at a $22.00 debit. This vertical spread risks $2,200 to target a potential $3,800 profit, offering a reward-to-risk ratio of 1.73:1. The 695 strike sits just below current levels and aligns with recent consolidation support, while the 755 strike provides room for upside toward key post-earnings technical levels. With 43 days to expiration, the trade allows for both an earnings-driven move and post-event continuation.
GS – Daily
Trade Details
Strategy Details
Strategy: Long Call Vertical Spread
Direction: Bullish Debit Spread
Details: Buy to Open 1 GS Aug 22 $695/$755 Call Vertical Spreads @ $22.00 Debit per Contract.
Total Risk: This trade has a max risk of $2,200 (1 Contract x $2,200) based on a hypothetical $100k portfolio risking 2%. We suggest risking only 2% of the value of your portfolio and divide it by $2,200 to select the # contracts for your portfolio.
Trend Continuation Signal: This is a bullish trade on a stock that is expected to continue higher over the duration of this trade.
1M/6M Trends: Bullish/Bullish
Relative Strength: 10/10
OptionsPlay Score: 101
Stop Loss: @ $11.00 (50% loss of premium)
View GS Trade
Entering the Trade
Use the following details to enter the trade on your trading platform. Please note that whenever there is a multi-leg option strategy, it should be entered as a single trade.
PLEASE NOTE that these prices are based on Wednesday’s closing prices. Should the underlying move significantly during the pre-market hours, we will likely adjust the strikes and prices to reflect a more accurate trade entry.
View GS Trade
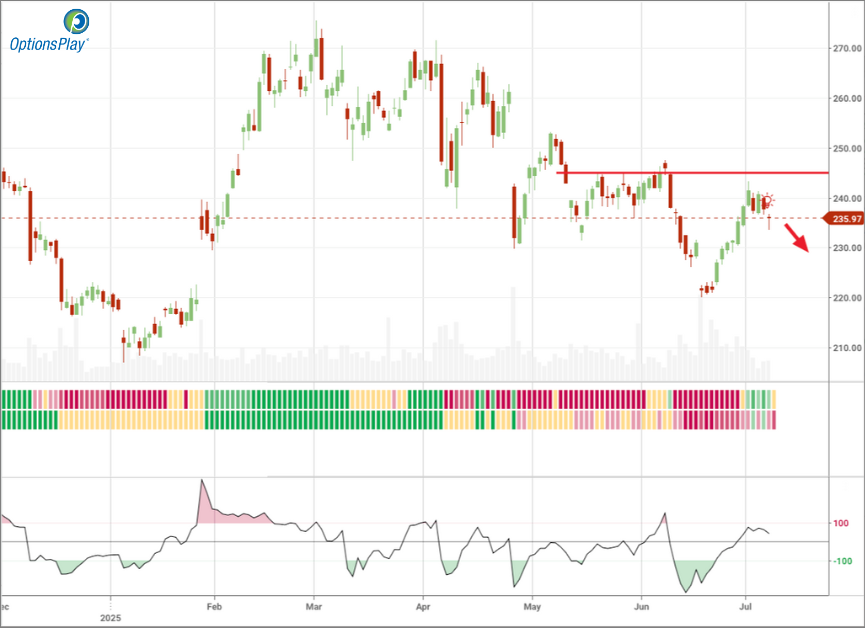
TMUS

DailyPlay – Opening Trade (TMUS) – July 09, 2025
TSLA Bearish Opening Trade Signal
Investment Rationale
Investment Thesis
T-Mobile US Inc. (TMUS) presents an attractive bearish setup as it rallies within a broader downtrend, creating a potential opportunity to initiate bearish exposure with defined risk. Despite its modest growth profile, TMUS continues to trade at a substantial premium to peers, suggesting that recent strength could reverse if the market refocuses on its valuation concerns. With price action confirming technical weakness and fundamentals offering limited justification for its premium, the risk/reward favors positioning for downside continuation towards key support levels. Additionally, TMUS is scheduled to report earnings on Wednesday, July 23rd after market close, which may act as a potential catalyst for volatility in line with this bearish thesis.
Technical Analysis
TMUS has recently experienced a rally back into its $240 resistance area within a longer-term bearish trend, creating a favorable entry for trend-following shorts. Notably, today the stock crossed below its 200-day moving average at $236.08, reinforcing its medium-term technical weakness. The recent rejection near the declining 50-day moving average further confirms the bearish momentum, with the next major support sitting near $220. Relative strength remains middling, offering no evidence of bullish leadership, and instead aligning with the broader technical deterioration.
Fundamental Analysis
TMUS remains significantly overvalued relative to industry peers despite only moderately stronger growth expectations, suggesting limited fundamental support at current prices:
- Forward PE Ratio: 22.55x vs. Industry Median 10.03x
- Expected EPS Growth: 15.89% vs. Industry Median 5.56%
- Expected Revenue Growth: 5.21% vs. Industry Median 2.54%
- Net Margins: 14.41% vs. Industry Median 12.72%
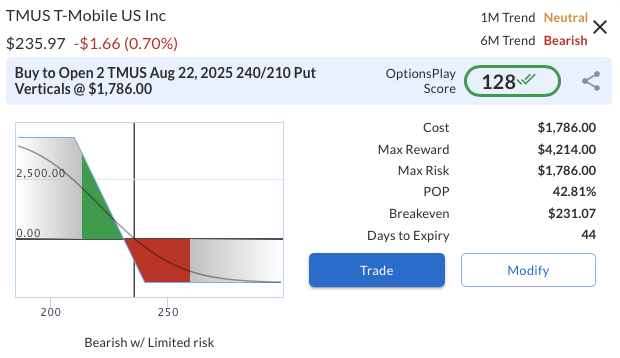
Options Trade
A bearish put vertical is structured via buying the TMUS Aug 22, 2025 $240 put and selling the $210 put for a net debit of $8.93 ($893 total risk). The trade risks $893 to potentially gain $2,107 if TMUS closes below $210 at expiration.This setup results in a risk/reward ratio of approximately 1:2.4, meaning for every $1.00 of risk, the trade offers $2.40 of potential reward. This vertical spread limits risk to the premium paid, aligning with the technical breakdown, upcoming earnings catalyst, and overvaluation thesis while maintaining favorable capital efficiency.
TMUS – Daily
Trade Details
Strategy Details
Strategy: Long Put Vertical Spread
Direction: Bearish Debit Spread
Details: Buy to Open 2 TMUS Aug 22 $240/$210 Put Vertical Spreads @ $8.93 Debit per Contract.
Total Risk: This trade has a max risk of $1,786 (2 Contract x $893) based on a hypothetical $100k portfolio risking 2%. We suggest risking only 2% of the value of your portfolio and divide it by $893 to select the # contracts for your portfolio.
Trend Continuation Signal: This is a bearish trade on a stock that is expected to continue lower over the duration of this trade.
1M/6M Trends: Neutral/Bearish
Relative Strength: 6/10
OptionsPlay Score: 128
Stop Loss: @ $4.47 (50% loss of premium)
View TMUS Trade
Entering the Trade
Use the following details to enter the trade on your trading platform. Please note that whenever there is a multi-leg option strategy, it should be entered as a single trade.
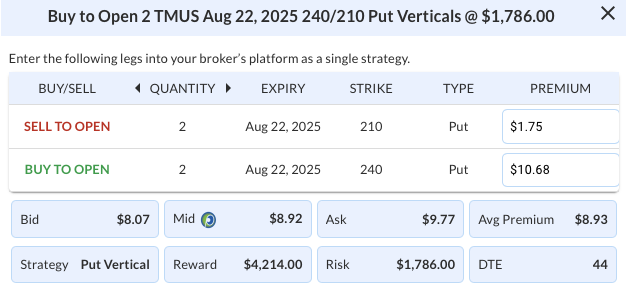
PLEASE NOTE that these prices are based on Tuesday’s closing prices. Should the underlying move significantly during the pre-market hours, we will likely adjust the strikes and prices to reflect a more accurate trade entry.
View TMUS Trade
TSLA
DailyPlay – Opening Trade (TSLA) – July 08, 2025
TSLA Bearish Opening Trade Signal
Investment Rationale
Investment Thesis:
Tesla Inc. (TSLA) presents a compelling bearish setup ahead of its Q2 earnings report, scheduled for Wednesday, July 23rd after market close. Despite optimism around its long-term innovation narrative, near-term price action and valuation continue to decouple from realistic fundamental support. The stock has recently failed to sustain momentum above key resistance levels, while sentiment has turned more cautious amid broader EV demand concerns and increasingly competitive market dynamics. With earnings risk approaching and limited upside catalysts, TSLA offers a tactically favorable short opportunity into the event.
Technical Analysis:
Price action in TSLA shows persistent distribution beneath the $350 resistance zone, where sellers have repeatedly capped rallies over the past year. The stock has now broken below its 50-day and 20-day moving averages, with a fresh bearish crossover developing between the short-term MAs. The rejection near $318 in early July reinforces this technical weakness, and momentum indicators like RSI have slipped toward neutral-bearish territory at 40. A breakdown below $290 confirms a lower high and opens the door toward the $250 support region, with the $180 level representing a longer-term downside target.
Fundamental Analysis:
TSLA remains fundamentally overvalued even as growth expectations compress and margins tighten under macro and competitive pressure. While Tesla’s topline metrics continue to outpace the sector, the extreme premium attached to its stock is increasingly difficult to defend.
- Forward PE Ratio: 167.38x vs. Industry Median 11.45x
- Expected EPS Growth: 17.82% vs. Industry Median 8.30%
- Expected Revenue Growth: 12.95% vs. Industry Median 3.06%
- Net Margins: 6.70% vs. Industry Median 2.71%
Options Trade:
With implied volatility elevated ahead of earnings and recent news headlines adding downside pressure, this structure offers a defined-risk way to express a bearish view. The 295/245 bear put vertical spread balances risk while providing strong convexity to the downside. The maximum potential reward of $3,344 vs. a defined risk of $1,656 delivers a favorable risk-reward ratio into a potentially volatile setup with 31 days to expiration.
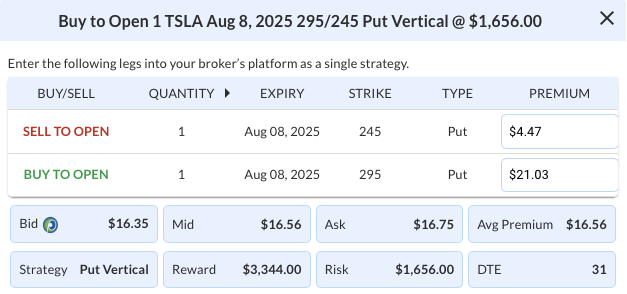
TSLA – Daily
Trade Details
Strategy Details
Strategy: Long Put Vertical Spread
Direction: Bearish Debit Spread
Details: Buy to Open 1 TSLA Aug 08 $295/$245 Put Vertical Spreads @ $16.56 Debit per Contract.
Total Risk: This trade has a max risk of $1,656 (1 Contract x $1,656) based on a hypothetical $100k portfolio risking 2%. We suggest risking only 2% of the value of your portfolio and divide it by $1,656 to select the # contracts for your portfolio.
Trend Continuation Signal: This is a bearish trade on a stock that is expected to continue lower over the duration of this trade.
1M/6M Trends: Bearish/Bearish
Relative Strength: 2/10
OptionsPlay Score: 127
Stop Loss: @ $8.28 (50% loss of premium)
View TSLA Trade

Entering the Trade
Use the following details to enter the trade on your trading platform. Please note that whenever there is a multi-leg option strategy, it should be entered as a single trade.
PLEASE NOTE that these prices are based on Monday’s closing prices. Should the underlying move significantly during the pre-market hours, we will likely adjust the strikes and prices to reflect a more accurate trade entry.
View TSLA Trade
DailyPlay – Portfolio Review – July 07, 2025
DailyPlay Portfolio Review
Our Trades
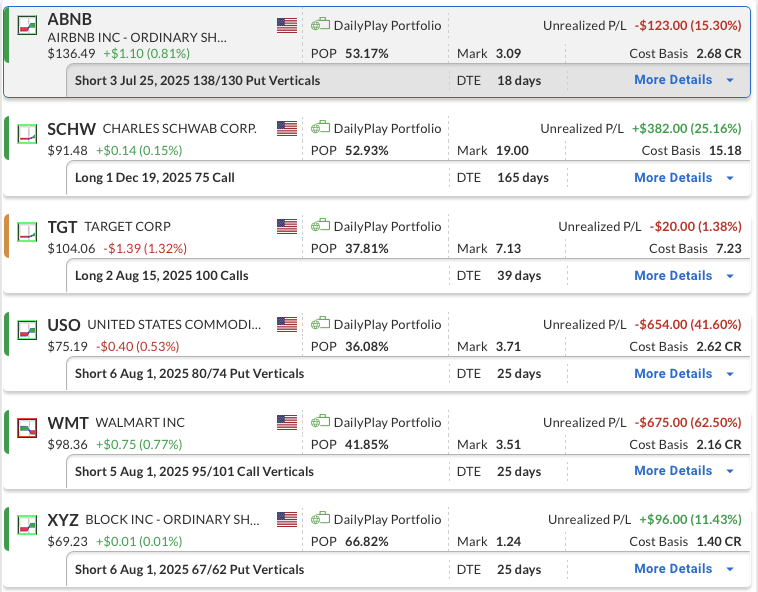
ABNB – 18 DTE
Bullish Credit Spread – Airbnb Inc. (ABNB) – The position is slightly down, as the stock broke out to the upside from its range and is now trading above its 200-day moving average, generating upside momentum. We plan to stay the course for now.
SCHW – 165 DTE
Bullish Long Call – Charles Schwab Corp. (SCHW) – Our outlook remains positive, supported by strong company fundamentals and continued strength in both SCHW and the broader financial sector.
TGT – 39 DTE
Bullish Long Call – Target Corporation (TGT) – We recently established this position and have a slight profit. We will stay the course for now, as the setup remains intact and the potential for additional upside is still in play.
USO – 25 DTE
Bullish Credit Spread – United States Oil Fund, LP (USO) – The position is down at the moment, and we’re keeping a close eye on oil prices leading into the OPEC International Seminar on July 9th and 10th, a key event that could move the market. With plenty of time left until expiration, we intend to stay the course.
WMT – 25 DTE
Bearish Credit Spread – Walmart Inc. (WMT) – The position is currently down, as the stock has remained range-bound. The bottom of the channel, near the 95 level, is an important downside support level that needs to break to generate momentum. At this stage, we plan to hold steady.
XYZ – 25 DTE
Block is trading above its 20-day and 50-day moving averages and is now testing the 200-day level near $71. The stock’s bullish trend remains intact, supported by steady volume and neutral RSI. We plan to stay the course for now.
MU, AAPL
DailyPlay – Closing Trade (MU, AAPL) – July 03, 2025
MU – 61% loss: Sell to Close 2 Contracts (or 100% of your Contracts) July 18 $125/$145 Call Vertical Spreads @ $2.30 Credit.
DailyPlay Portfolio: By Closing 2 Contracts, we will be collecting $460. We initially opened these 2 contracts on June 25 @ $5.86 Debit. Our loss, therefore, is $356 per contract.
AAPL – 78% loss: Sell to Close 3 Contracts (or 100% of your Contracts) July 18 $205/$195 Put Vertical Spreads @ $1.15 Credit.
DailyPlay Portfolio: By Closing 3 Contracts, we will be collecting $345. We adjusted the 3 short puts on June 26 reducing our cost basis to $1,590 Debit. Our loss, therefore, is $415 per contract.
TGT
DailyPlay – Opening Trade (TGT) – July 02, 2025
TGT Bullish Opening Trade Signal
Investment Rationale
Investment Thesis:
Target Corp. (TGT) appears to be at a potential inflection point following a multi-year drawdown, offering an attractive setup for investors seeking value with upside optionality. Despite being down more than 50% from its highs, the stock has recently shown signs of stabilization and regained critical levels, suggesting improving sentiment. In a defensive retail space where peers trade at rich valuations and compressing margins, Target stands out with its attractive earnings multiple, strong dividend yield, and industry-leading profitability. As macro pressures from tariffs and inflation persist, TGT’s lean cost structure and disciplined capital return profile offer an edge in a risk-conscious market.
Technical Analysis:
TGT has broken out above the key $100 psychological level after months of basing, supported by rising short-term moving averages and strengthening volume trends. The price action now shows early trend development, with the stock pressing against the $104 level and attracting momentum buyers. RSI at 64 indicates building upside pressure without entering overbought territory, while the upward-sloping 20-day and 50-day MAs reflect a short-term shift in trend. The setup favors a move toward the $120–130 resistance zone, offering an asymmetric opportunity for early entry before broader confirmation.
Fundamental Analysis:
TGT trades at a substantial discount to its peers despite growth expectations that are in line and net margins that beat more than 75% of its peers.
- Forward PE Ratio: 13.49x vs. Industry Median 18.09x
- Expected EPS Growth: 9.22% vs. Industry Median 8.99%
- Expected Revenue Growth: 1.15% vs. Industry Median 5.26%
- Net Margins: 3.95% vs. Industry Median 2.29%
Options Trade:
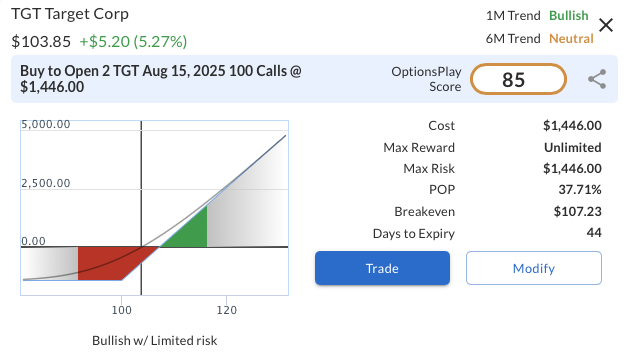
After the breakout, we are considering Buy to Open 1 TGT Aug 15, 2025 $100 Call @ $723. This long call strategy provides upside exposure with defined risk, controlling 100 shares for just 7% of the stock’s price. The $100 strike is now slightly in-the-money, aligning with the recent technical breakout and capturing further upside toward the $120–130 resistance zone. The maximum risk is the $723 premium paid, while the potential reward exceeds 3:1 if shares approach $130, offering a leveraged way to play a continued recovery in TGT.
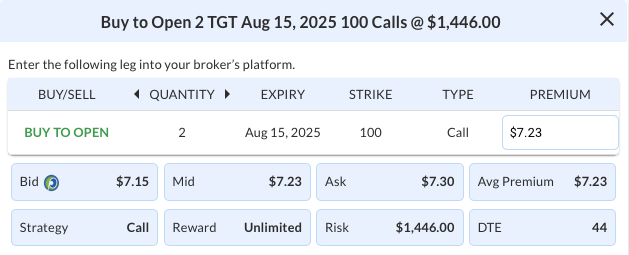
TGT – Daily
Trade Details
Strategy Details
Strategy: Long Call
Direction: Bullish Call
Details: Buy to Open 2 TGT Aug 15 $100 Call @ $7.23 Debit per Contract.
Total Risk: This trade has a max risk of $1,446 (2 Contracts x $723) based on a hypothetical $100k portfolio risking 2%. We suggest risking only 2% of the value of your portfolio and divide it by $723 to select the # contracts for your portfolio.
Trend Continuation Signal: This is a bullish trade on a stock that is expected to continue higher over the duration of this trade.
1M/6M Trends: Bullish/Neutral
Relative Strength: 2/10
OptionsPlay Score: 85
Stop Loss: @ $3.62 (50% loss of premium)
View TGT Trade
Entering the Trade
Use the following details to enter the trade on your trading platform. Please note that whenever there is a multi-leg option strategy, it should be entered as a single trade.
PLEASE NOTE that these prices are based on Tuesday’s closing prices. Should the underlying move significantly during the pre-market hours, we will likely adjust the strikes and prices to reflect a more accurate trade entry.
View TGT Trade
XYZ
DailyPlay – Opening Trade (XYZ) & Closing Trade (MSFT) – July 01, 2025
Closing Trade
- MSFT – 52% gain: Buy to Close 2 Contracts (or 100% of your Contracts) Aug 01 $475/$460 Put Vertical Spreads @ $2.45 Debit. DailyPlay Portfolio: By Closing 2 Contracts, we will be paying $490. We initially opened these 2 contracts on June 17 @ $5.07 Credit. Our gain, therefore, is $524.
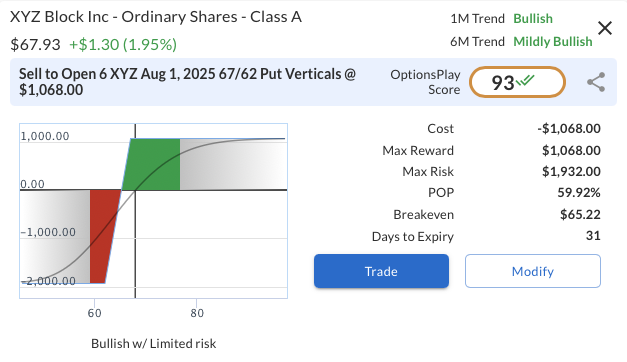
XYZ Bullish Opening Trade Signal
Investment Rationale
Investment Thesis:
Block Inc. (XYZ) presents a timely bullish setup, supported by strong recent price action and an attractive valuation. With earnings scheduled for August 7, 2025, traders have an opportunity to position ahead of the event without taking on direct earnings risk. Momentum has continued to build, and as the stock outperforms the broader market, our $85 upside target remains in focus. Our options strategy is designed to capture this strength while avoiding earnings-related volatility.
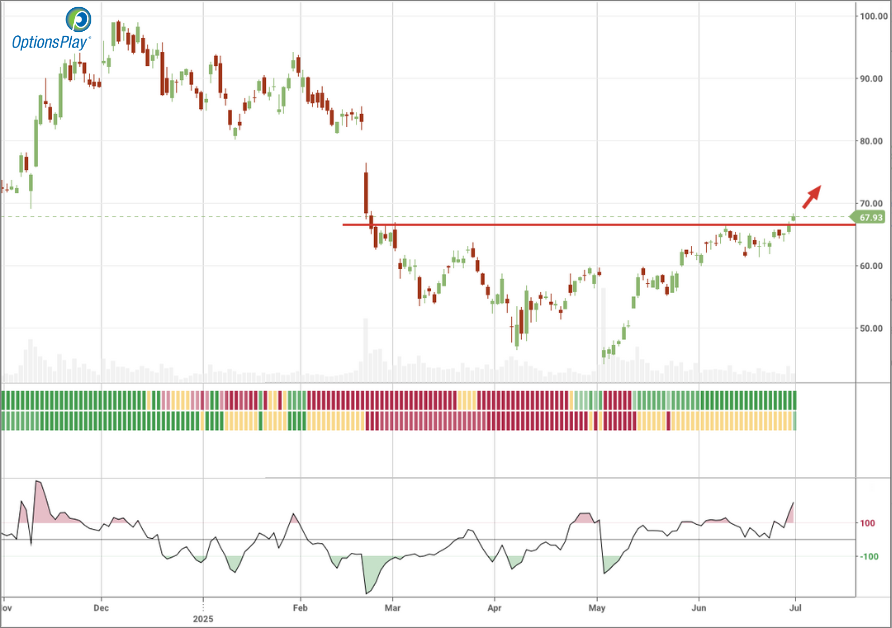
Technical Analysis:
XYZ recently broke out above multi-month consolidation with sustained accumulation and a constructive pattern of higher lows and higher highs. The stock has reclaimed both the 20-day and 50-day moving averages and is now pushing toward the 200-day at $71.32, which marks the next key resistance level. Relative strength continues to improve, and with volume building and RSI trending higher, the price action supports a bullish continuation setup. The $62 level marks solid support, aligning with the breakout base and prior resistance zone from late May.
Fundamental Analysis:
XYZ trades at a discount relative to its industry while boasting growth and profitability metrics that exceed its sector peers. The valuation gap, coupled with strong earnings and revenue projections, signals potential for multiple expansion and continued investor re-rating.
- Forward PE Ratio: 14.65x vs. Industry Median 26.35x
- Expected EPS Growth: 23.90% vs. Industry Median 11.69%
- Expected Revenue Growth: 11.39% vs. Industry Median 9.38%
- Net Margins: 10.93% vs. Industry Median 8.59%
Options Trade:
To capitalize on the bullish setup while avoiding earnings risk, we recommend selling a short-dated put vertical: Sell to Open 1 XYZ Aug 1, 2025 67/62 Put Vertical @ $1.78. This trade collects a net credit of $1.78 ($178) with a defined risk of $3.22 ($322), yielding a potential 55% return on risk if XYZ stays above $67 through expiration. With 31 days to expiry, the setup benefits from time decay and technical support near $62, while avoiding the Aug 7 earnings event altogether.
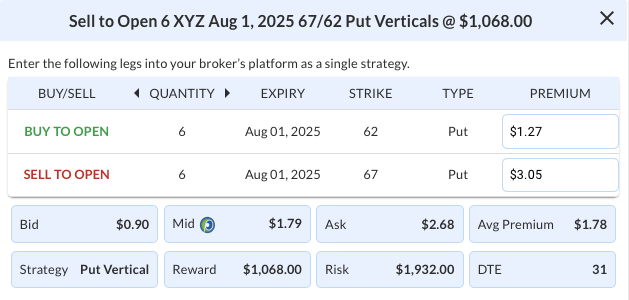
XYZ – Daily
Trade Details
Strategy Details
Strategy: Short Put Vertical Spread
Direction: Bullish Credit Spread
Details: Sell to Open 6 XYZ Aug 01 $67/$62 Put Vertical Spreads @ $1.78 Credit per Contract.
Total Risk: This trade has a max risk of $1,932 (6 Contracts x $322) based on a hypothetical $100k portfolio risking 2%. We suggest risking only 2% of the value of your portfolio and divide it by $322 to select the # contracts for your portfolio.
Trend Continuation Signal: This is a bullish trade on a stock that is expected to continue higher over the duration of this trade.
1M/6M Trends: Bullish/Mildly Bullish
Relative Strength: 2/10
OptionsPlay Score: 93
Stop Loss: @ $3.56 (100% loss to value of premium)
View XYZ Trade
Entering the Trade
Use the following details to enter the trade on your trading platform. Please note that whenever there is a multi-leg option strategy, it should be entered as a single trade.
PLEASE NOTE that these prices are based on Monday’s closing prices. Should the underlying move significantly during the pre-market hours, we will likely adjust the strikes and prices to reflect a more accurate trade entry.